This morning John Mueller dropped a one-line question in Slack: “Is there a Search Console → Trading View adapter?”
I checked. There isn’t. Plenty of extensions add line and bar charts to Search Console, and TradingView’s only route for custom data (Pine Seeds) no longer accepts new repositories. But the question stuck, because he’s right that it should exist.
The Search Console performance chart is a line that goes up and down every weekend. That is most of what it tells you. Is last week’s dip a trend break, or just Sunday? Did the core update hurt you, or did it only make your traffic more volatile? A single smoothed line can’t answer either question.
Traders solved this decades ago. A candlestick chart shows where a period opened, where it closed, and how far it swung in between. Add a couple of moving averages and you see trend changes before they show up in your monthly report.
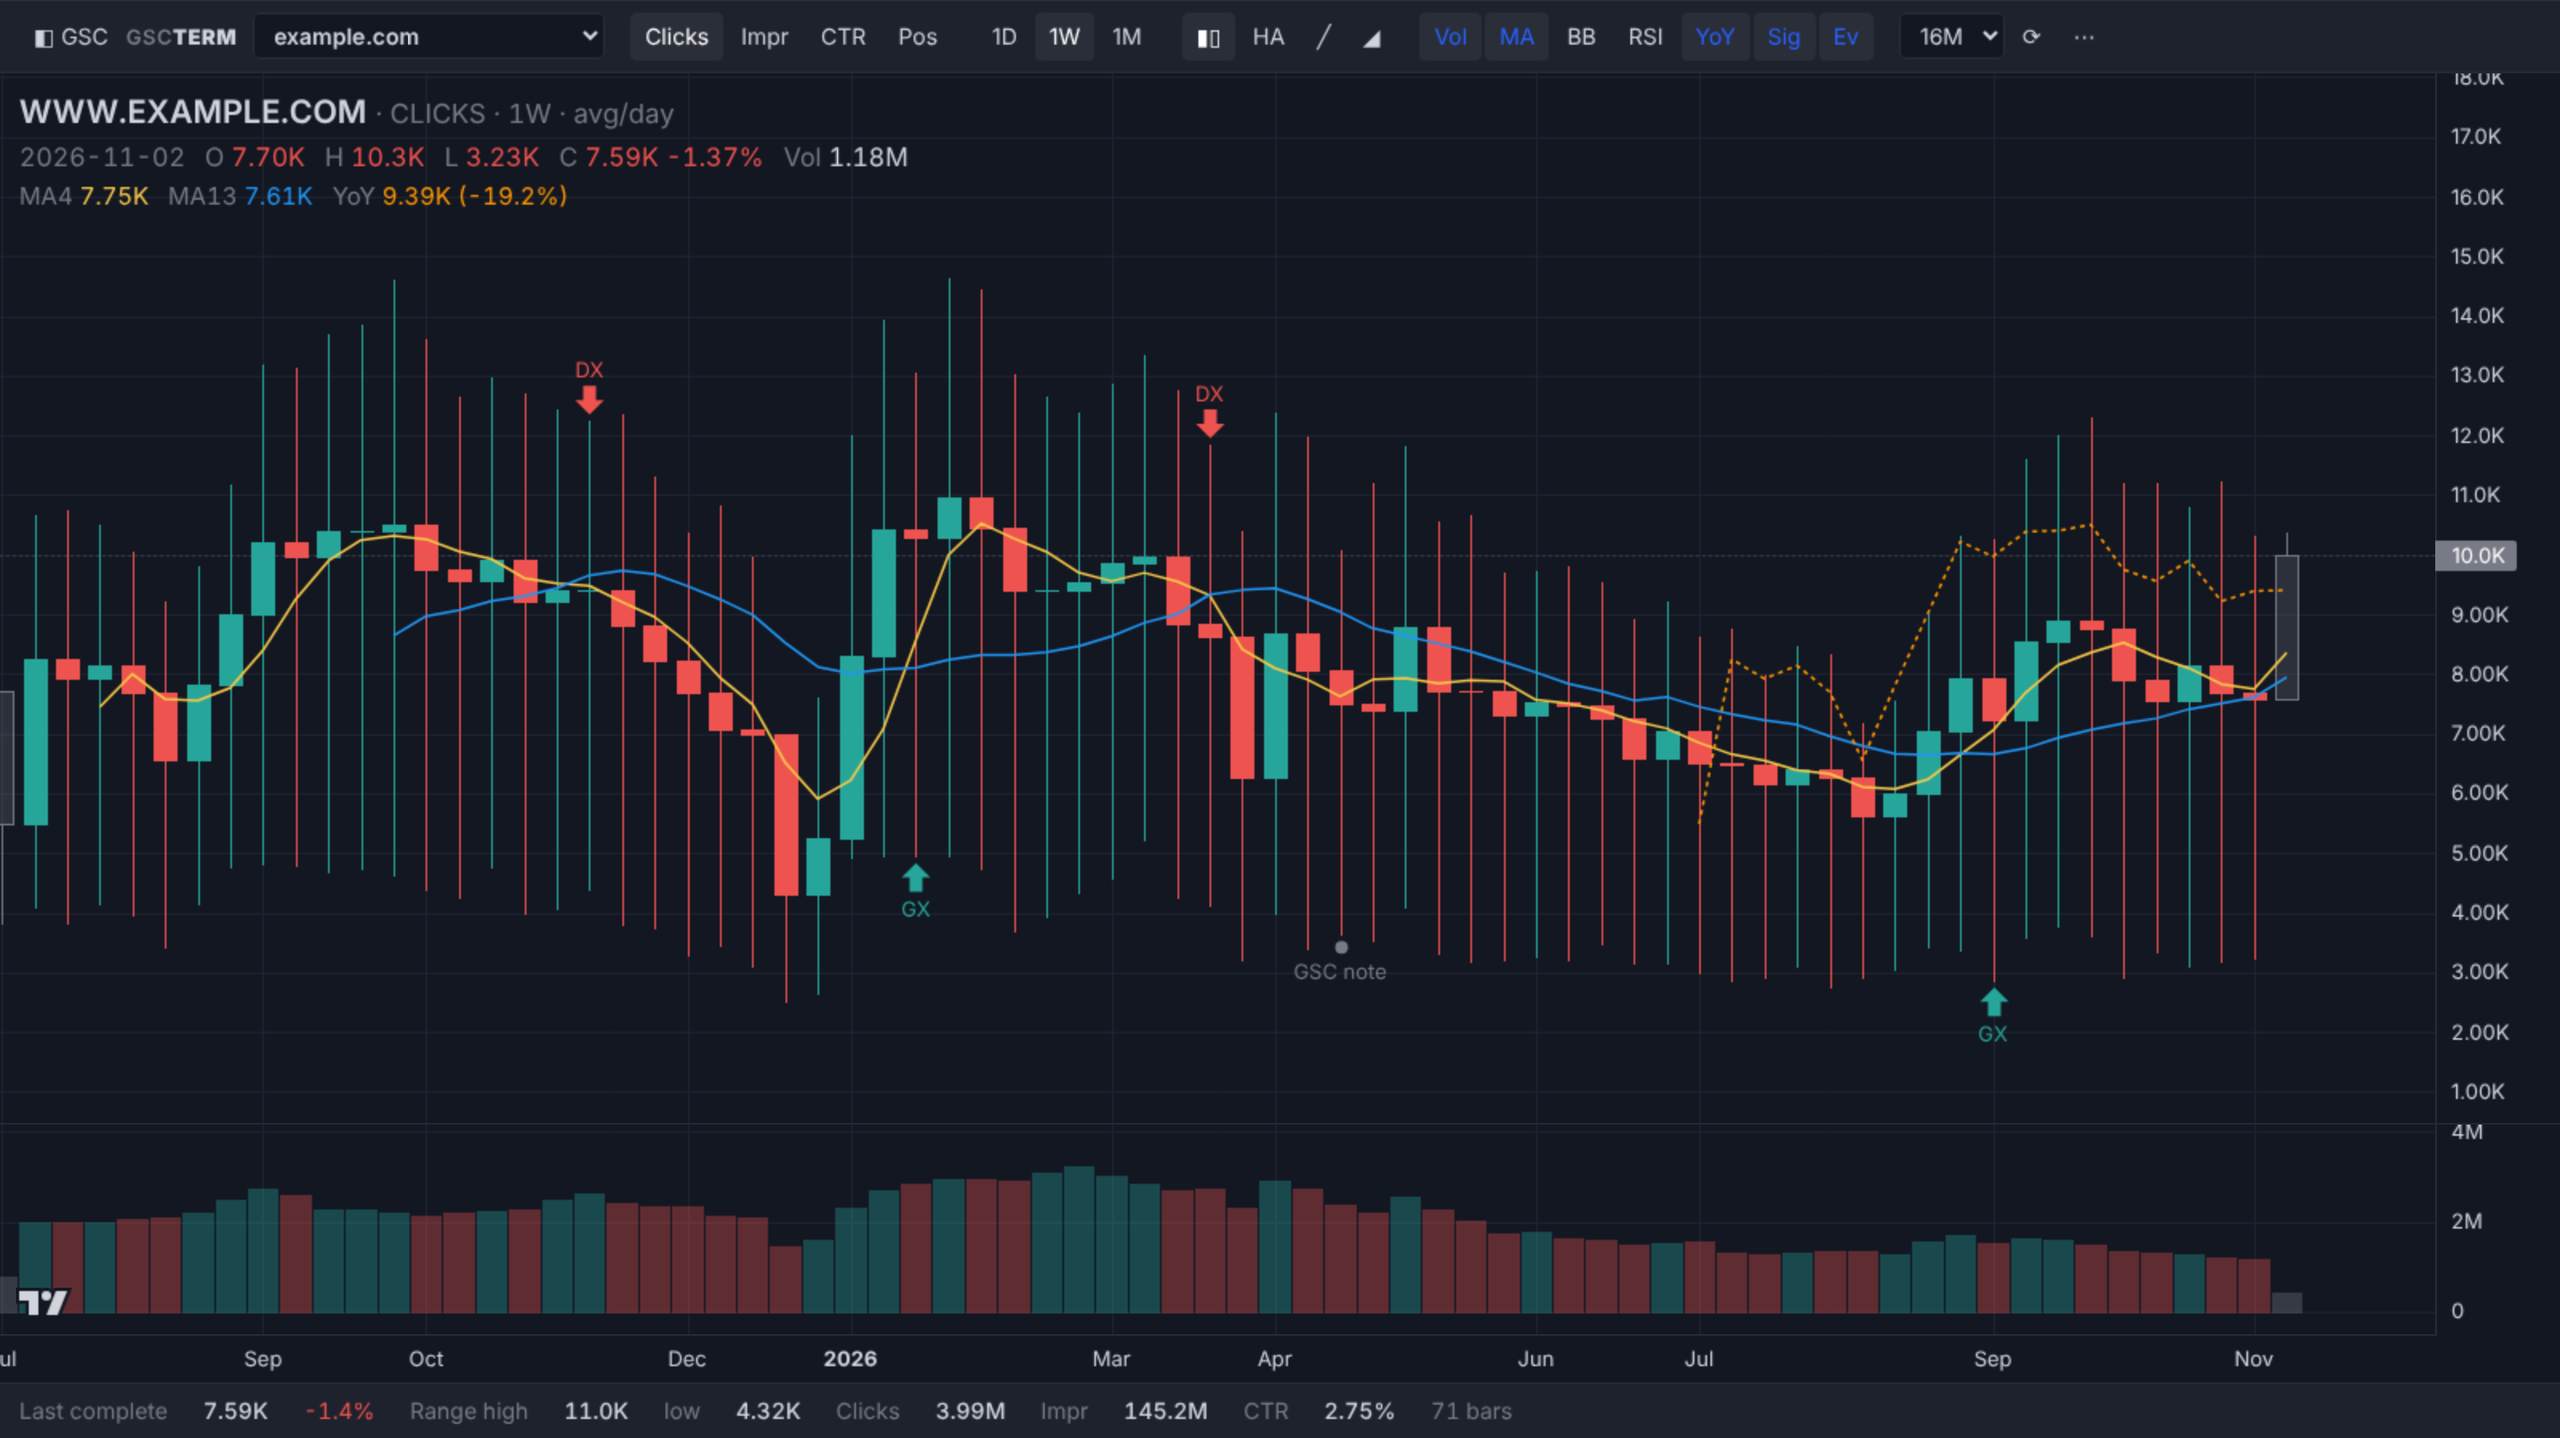
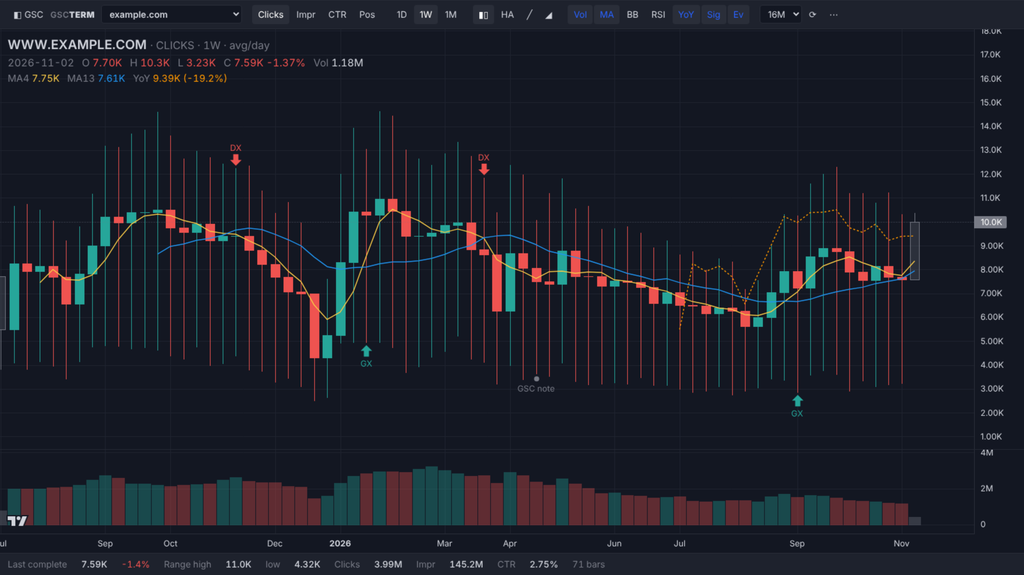
So I built it the same day: GSC Terminal, a Chrome extension that replaces the Search Console performance report with a TradingView-style chart. Same property, same filters, same data. Just a far better way to read it.
What it does
Open any performance report in Search Console. A second after Google draws its own chart, GSC Terminal takes over the page below the Search Console header.
- Same view, longer history. It picks up the property, report, search type and every filter you set in Search Console, and loads up to 16 months of daily data for it.
- Candles, Heikin Ashi, line or area on daily, weekly or monthly bars.
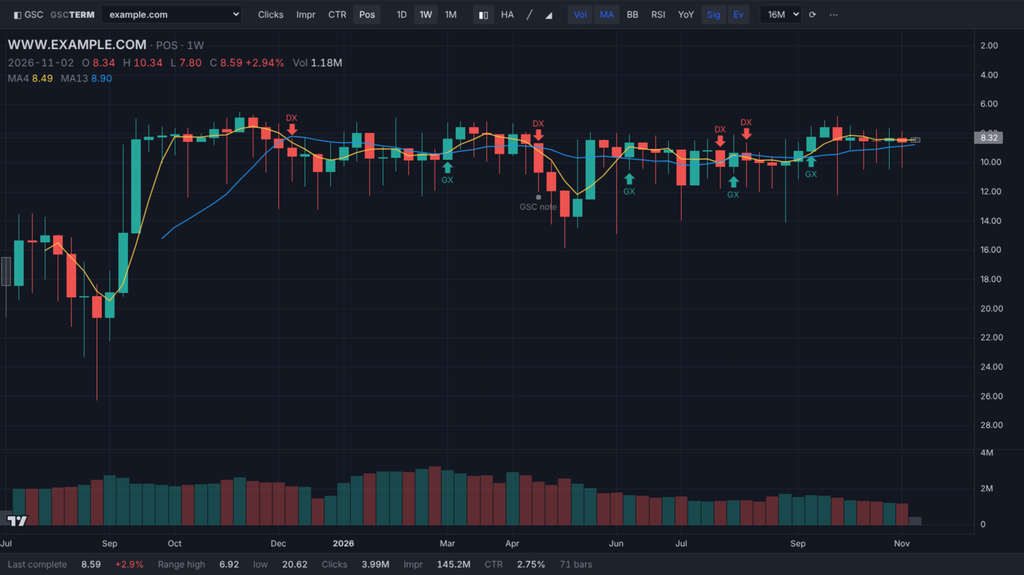
- Clicks, impressions, CTR and position. Position uses an inverted scale, so up and green always mean better.
- Indicators: moving averages with crossover signals, Bollinger Bands, RSI, a volume pane and a year-over-year overlay.
- Event markers for your own notes (“core update”, “migration”) plus Search Console’s own data annotations.
- The new Generative AI report works too, which has no API equivalent.
- No OAuth, no Google Cloud project, no API quota. It uses the session you are already logged in with, including every
/u/N/account.
Installing it
GSC Terminal isn’t in the Chrome Web Store, so you load it as an unpacked extension. It takes two minutes. Open source via https://github.com/jbobbink/gsc-terminal
- Download the zip: gsc-terminal-1.2.0.zip.
- Unzip it somewhere permanent, for example
Documents/gsc-terminal. Chrome loads the extension from that folder, so don’t delete it afterwards. - Go to
chrome://extensionsand switch on Developer mode (top right). - Click Load unpacked and pick the folder that contains
manifest.json. - Optional: pin GSC Terminal via the puzzle-piece icon.
- Reload any Search Console tabs you already had open. Extensions don’t run in tabs that were open before installing.
It works in Google Chrome. It should also run in other Chromium browsers, but I only tested Chrome.
Updating works the same way: replace the folder contents, click the reload icon on the extension’s card, and reload Search Console.
Using it inside Search Console
The workflow is simple: Search Console decides what you look at, GSC Terminal decides how you look at it.
- Open a performance report. Search results, Discover, News or Generative AI. The terminal takes over automatically.
- Need a different filter? Click ◧ GSC in the toolbar, or press Alt+T. You’re back in the normal report. Set a query, page, country or device filter with Google’s own controls.
- Click 📈 Terminal (bottom right). The terminal reloads with the new filters. The active filters show next to the site name, for example
query ∋ empleo. - Switch property with the dropdown at the top. It navigates Search Console to that property, so you stay in the same report.
Once you switch back to the normal view, the terminal stops taking over pages automatically until you click 📈 Terminal again. That way it doesn’t jump in while you’re building a filter.
Inside the terminal:
| Control | What it does |
|---|---|
| Clicks / Impr / CTR / Pos | Metric on the chart. Keys c, i, r, p. |
| 1D / 1W / 1M | Bar size. Keys 1, 2, 3. |
| Candles / HA / line / area | Chart type. HA is Heikin Ashi: smoothed candles that make trend runs easier to see. |
| Vol, MA, BB, RSI, YoY, Sig, Ev | Toggle indicators, crossover signals and event markers. |
| 3M / 6M / 12M / 16M | History loaded. |
| ⋯ menu | Export the candles as CSV, manage events, load demo data. |
Double-click any bar to add an event, such as “Core update” or “Title rewrite”. Events are stored per property in your browser.
How to read the candles
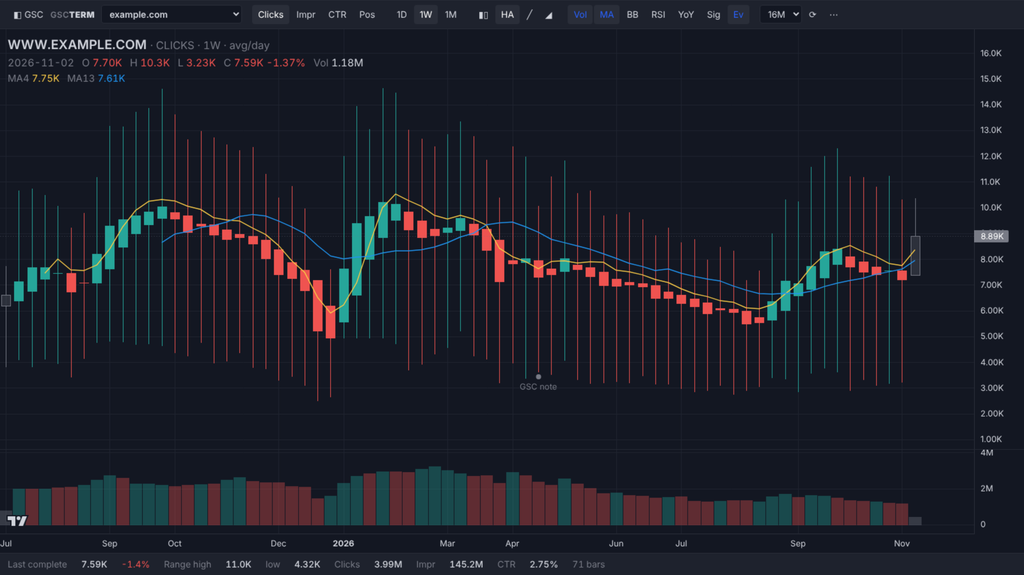
A stock candle summarises trades within a period. Search data has no trades, so I had to define what open, high, low and close mean for SEO. The goal: the body shows the trend, the wicks show the volatility.
| Part | Meaning in GSC Terminal |
|---|---|
| Close | The value for the bar. On weekly and monthly bars, clicks and impressions are averages per day, so a 4-week month and a 5-week month compare fairly. CTR is total clicks / total impressions; position is weighted by impressions. |
| Open | The previous bar’s close. A green body means this week beat last week. |
| High / low (wicks) | The best and worst single day inside the bar. |
| Volume | Total impressions in the bar (total clicks when you chart impressions). |
| Grey bar | Data Google still marks as incomplete. Don’t panic about it yet. |
Two patterns to watch:
- Long wicks, small bodies. Your weekly average is stable, but the days inside the week swing hard. On a B2B site that’s usually weekday versus weekend. When the wicks suddenly get longer without a seasonal reason, something changed in how Google serves you.
- A run of same-coloured bodies. Three or four red weekly candles in a row is a trend, not noise. That’s the moment to dig in, not when the monthly report lands.
Indicators that are actually useful for SEO
I don’t believe in technical analysis for predicting stock prices. Applied to your own search data it’s a different story: the indicators simply make trends and anomalies visible faster.
- Moving averages (MA). A fast and a slow average per bar size: 7/28 days on daily bars, 4/13 weeks on weekly bars, 3/12 months on monthly. On daily bars the windows cover whole weeks, so weekend dips cancel out instead of dragging the line around.
- Crossover signals (Sig). A GX marker appears when the fast average crosses above the slow one, DX when it crosses below. On weekly clicks a DX is a solid trigger to check what happened. Change the MA periods under Filters if they are too sensitive for your site.
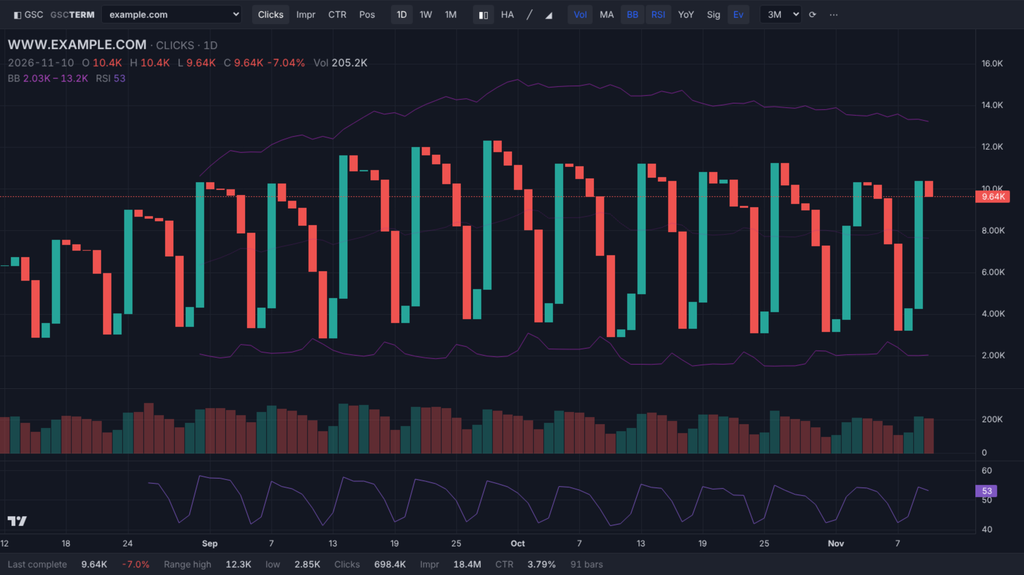
- Bollinger Bands (BB). A 20-bar average with a band of two standard deviations around it. A close outside the band is an anomaly worth a look: a ranking jump, a lost featured snippet, a tracking issue.
- RSI. Momentum on a 0 to 100 scale. A rising RSI while clicks still look flat often means growth is starting before it shows in the totals.
- YoY overlay. The value from exactly 52 weeks earlier as a dashed line, aligned on weekday. The legend shows the year-over-year change for whatever bar you hover. You need 16 months loaded to get a full year of overlap.
- Events (Ev). Your own markers plus Search Console’s annotations. Put a core update or a deploy on the chart and the cause-and-effect discussion with a client gets a lot shorter.
My default setup: weekly candles, MA and Sig on, volume on, YoY on. For a migration or a core update I switch to daily bars with Bollinger Bands.
The Generative AI report
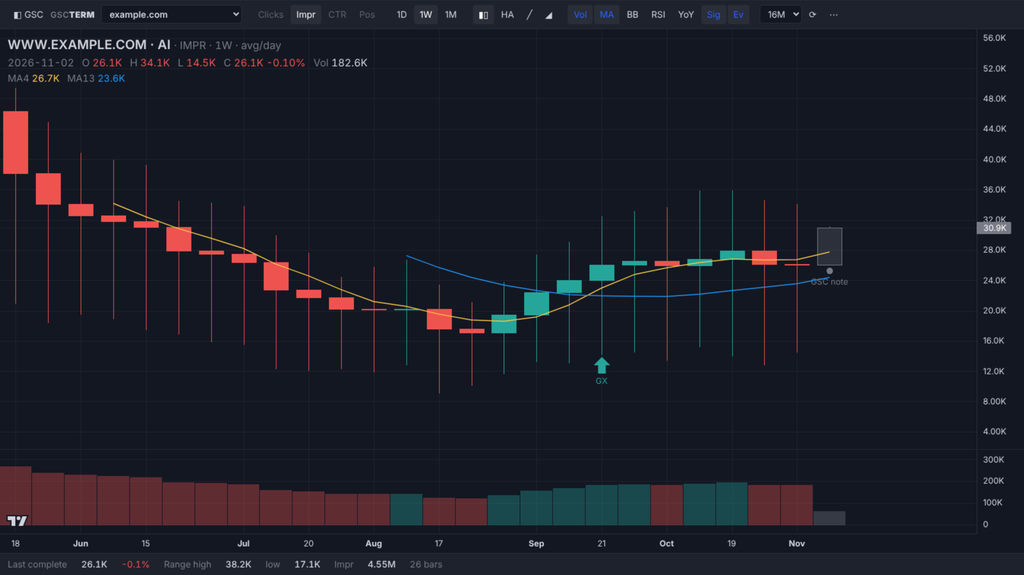
In June 2026 Google added a separate performance report for AI Overviews and AI Mode. It only shows impressions, and as far as I can tell there’s no way to get it through the Search Console API.
GSC Terminal reads it straight from the page, so it works there too. On the AI report the chart switches to impressions, the other metrics are greyed out, and the volume pane shows impressions. History starts when Google started collecting the data, around mid-May 2026 for the properties I checked.
For GEO work this is the most interesting view in the tool. AI impressions are volatile, and a weekly candle with a 4/13 moving average separates a real shift in AI visibility from a noisy week far better than Google’s line does.
How it works, and the catch
Search Console’s interface loads its chart data through an internal endpoint. When you open a report, the extension notes which request the page made: property, report type, search type and filters. It then makes that same request with a longer date range, inside your own logged-in session. The chart itself is TradingView’s open-source Lightweight Charts library.
That design has three consequences:
- Your data stays in your browser. Nothing goes to a server of mine. There’s no account, no tracking, and the extension only requests what the page could already load.
- It sees exactly what you see. Every property and every
/u/N/Google account you have access to works, without setting up OAuth. - It depends on an undocumented format. If Google changes how the interface loads its data, the terminal shows an error until I update it. The normal report keeps working, and you can always switch back with Alt+T.
The extension also has an optional API mode with your own OAuth client, which runs in a separate tab. The README in the zip explains how to set that up.
Try it
Download GSC Terminal here: gsc-terminal-1.2.0.zip. It’s free, and it never sends your data anywhere.
It started as an answer to John’s question, but it I already see some nice ways of using it usefully.